Worst economy rate in T20 International cricket career
Worst economy rate in T20 International cricket career
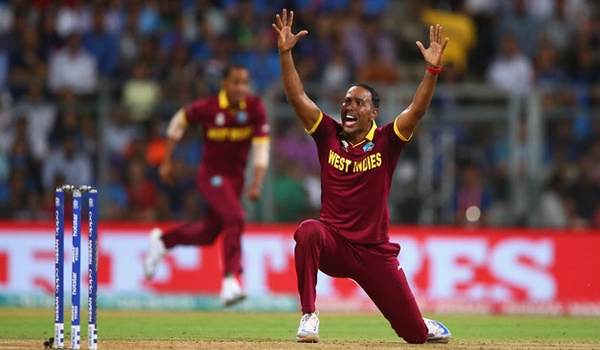
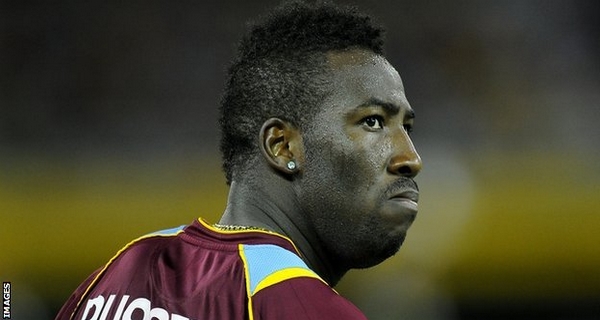
As discussed on a previous occasion, there are bowlers in the world with a less than 5 economy rate in T20 format. Although their number is pretty much rare, but that is something obviously expected in the shortest format of the game. Moving on from the best economy rate to worst economy rate in T20s, there are a few bowlers who are known for their extra run leak in this format. Although a 9 runs over in the modern day t20 format is not that expensive however still these are the worst we have at the moment. And the man holding the embarrassing record might surprise you even more. One of the best all-rounders around the sport Andre Russell holds the record of worst economy rate in T20s.

Although the West Indian is a handy bowler mixing the thing sup nicely at times, but when it comes to economy rate his skill gives up. The star player has bowled a total of 85 overs in T20 international matches giving away 787 runs at an economy rate of 9.24. Also the number of wickets he has taken in T20 format is uninspiring as well. Andre Russel has a total of 21 T20I wickets on his name – a number pretty low for a player of his caliber. After Andre Russell, it is Thisara Perera with the second worst economy rate in T20 format. Like Russel, Perera also has the T20I economy rate in the range of 9 runs per over.

Interestingly both these players are capable of scoring at the same rate when it comes to batting. Perera although is not a genuine batter but when it comes to hard hitting there is no stopping for him. And we all are well aware of the batting capabilities of the hard hitter Andre Russell. However unlike these two all bowlers are not lucky enough to repay the favor on their batting turns. Let’s check them all out.
Worst economy rate in T20 International cricket
| Player | Span | Mat | Overs | Mdns | Runs | Wkts | BBI | Ave | Econ |
| AD Russell (WI) | 2011-2016 | 43 | 85.1 | 0 | 787 | 21 | 2/10 | 37.47 | 9.24 |
| NLTC Perera (SL) | 2010-2016 | 54 | 111.2 | 1 | 1003 | 35 | 3/33 | 28.65 | 9.00 |
| JW Dernbach (ENG) | 2011-2014 | 34 | 117.0 | 1 | 1020 | 39 | 4/22 | 26.15 | 8.71 |
| JDP Oram (NZ) | 2005-2012 | 36 | 91.0 | 0 | 793 | 19 | 3/33 | 41.73 | 8.71 |
| TG Southee (NZ) | 2008-2015 | 38 | 137.0 | 2 | 1182 | 46 | 5/18 | 25.69 | 8.62 |
| DJ Bravo (WI) | 2006-2016 | 64 | 165.4 | 0 | 1401 | 51 | 4/28 | 27.47 | 8.45 |
| KD Mills (NZ) | 2005-2014 | 42 | 149.3 | 1 | 1228 | 43 | 3/26 | 28.55 | 8.21 |
| WD Parnell (SA) | 2009-2015 | 35 | 110.5 | 3 | 891 | 38 | 4/13 | 23.44 | 8.03 |
| TT Bresnan (ENG) | 2006-2014 | 34 | 110.3 | 1 | 887 | 24 | 3/10 | 36.95 | 8.02 |
| JA Morkel (SA) | 2005-2015 | 50 | 107.5 | 2 | 864 | 26 | 3/12 | 33.23 | 8.01 |